
Correcting Osaka’s Misleading Graph: Recalculating July 1–27 Temperatures
Recalculate Osaka daily observations for the same 27-day period and correct the old chart and extreme-heat-day count.
2 min read
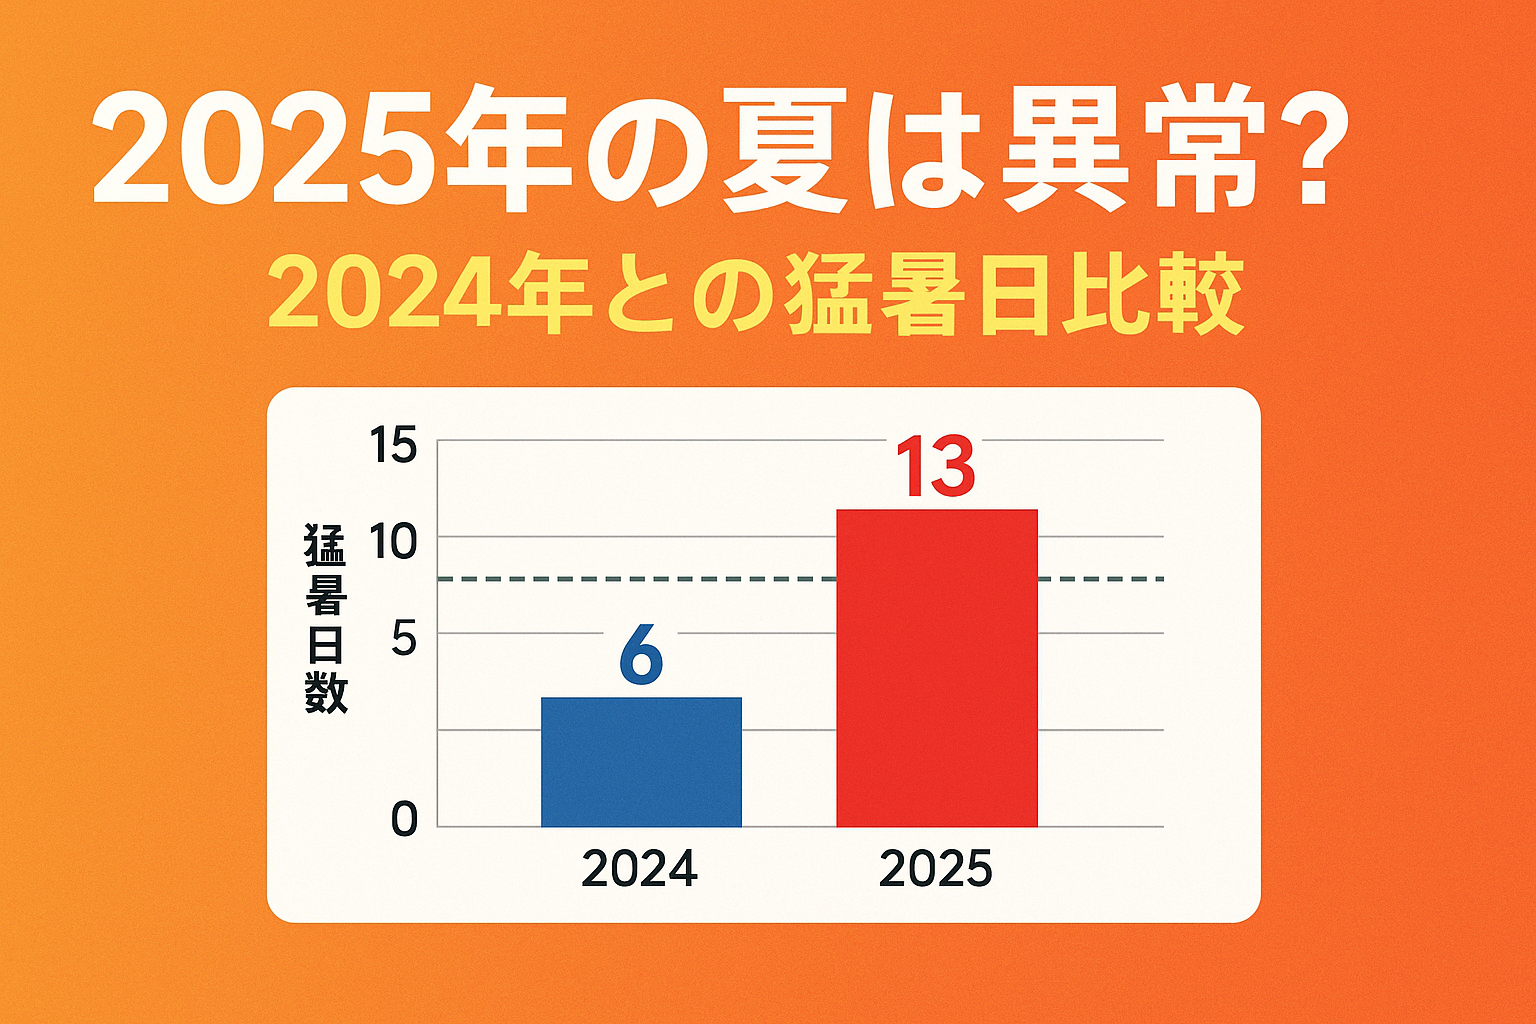
The old version compared Osaka daily maximum temperatures from July 1–27 in 2024 and 2025 and reported six versus thirteen days at or above 35°C. Rechecking the Japan Meteorological Agency observations gives ten days for 2024. The old chart also differs from the source on multiple dates, so it is no longer used as evidence.
Recalculation conditions
- Station: Osaka, station 47772
- Period: July 1–27 in each year
- Fields: daily mean, maximum, minimum, and mean relative humidity
- Extreme-heat count: daily maximum at or above 35.0°C
- Rounding: one decimal after calculating the mean
The same calculation was applied to the first 27 days in the 2024 table and 2025 table.
Corrected results
| Osaka, July 1–27 | 2024 | 2025 | Difference |
|---|---|---|---|
| mean of daily means | 29.3°C | 30.0°C | +0.7°C |
| mean daily maximum | 33.2°C | 35.0°C | +1.8°C |
| days at or above 35.0°C | 10 | 13 | +3 |
| days with daily minimum at or above 25.0°C | 20 | 24 | +4 |
| highest observed maximum | 36.4°C | 37.6°C | +1.2°C |
For this Osaka station and 27-day period, every listed temperature measure is higher in 2025. The table does not by itself establish a nationwide anomaly or that humidity caused the difference.
What the old version got wrong
- It counted six 2024 extreme-heat days; the daily table contains ten.
- Multiple plotted daily maximums did not match the JMA table.
- It extended a maximum-temperature comparison into claims about nights, wind, and WBGT.
WBGT is not air temperature alone. This article no longer asserts that more days crossed a WBGT threshold without the corresponding data.
Limits
- One Osaka station does not represent Japan.
- The period ends on July 27 and is not the full summer.
- Daily minimum at or above 25°C is a simple daily measure, not a separately calculated official nighttime period.
- Individual health risk also depends on exposure, activity, indoor conditions, and personal factors.
Conclusion
For the same Osaka station and July 1–27 period, 2025's mean daily maximum was 1.8°C higher and there were three more days at or above 35°C. The old six-versus-thirteen count and chart are corrected. Use current local weather and heat-health alerts for decisions.
Primary sources checked
Important claims should also link to the relevant source in the article body.
- Osaka daily values for July 2024Japan Meteorological Agency · government · Checked: 2026-07-26
- Osaka daily values for July 2025Japan Meteorological Agency · government · Checked: 2026-07-26