
How I Ended Up Developing Stock Trading Software | The Joy of Development That Starts with a Spontaneous Idea
A development log summarizing the process and lessons learned as a stock trading software—which I started building based solely on an idea—evolved from data retrieval to graph display and return calculation. Includes curiosity-driven development tips.
4 min read
Feature and specification statements were checked on July 31, 2026 against null. The article distinguishes what the official source confirms from editorial organization and recommendations.
Introduction
“It was just a random thought, but…”
There are moments like that, aren’t there, when you start tinkering with some code on a whim, and it gradually turns into a “creation” in its own right?
That’s exactly what this article is about.
It’s a story that traces the process of how a small idea that started “just on a whim” grew—before I knew it—into a full-fledged tool capable of retrieving stock price data, plotting charts, and calculating returns.
I’ll take you behind the scenes of the development, delving into why I built it, what I learned along the way, and more.
Why I Built Stock Analysis Software on a Whim
The Motivation to Start Development Was “Curiosity,” Not “Necessity”
- I’d grown tired of just checking stock prices on my smartphone every day
- I felt that “if I did the calculations myself, I’d understand the results better”
- It was the perfect technical experiment (Rust, WASM, TypeScript, API retrieval, etc.)
The key point here is the lighthearted attitude of “I built it because I was curious,” rather than “I’m building it because I need it.”
In fact, that lighthearted approach is what keeps the development moving forward.
First, I Tried Retrieving the Data (Subquery: How to Retrieve Stock Data)
Using Stooq’s CSV API, it turned out to be surprisingly straightforward
- No API key required
- Retrieve data simply by specifying a ticker, like
https://stooq.pl/q/d/l/?s=7203.jp&i=d - Supports both Japanese and U.S. stocks
- Added a mechanism to fall back to a local CSV file in case of failure
Answer to the Search Intent
In response to “How do I get stock prices?” → There’s a way to get them easily and for free
Insight
Thanks to its simplicity—no API key required—it’s perfect for “just giving it a try.”
Action Plan
Combine Stooq with a local CSV file to treat it like your own database.
I Tried Drawing a Chart (Subquery: Chart Rendering Library)
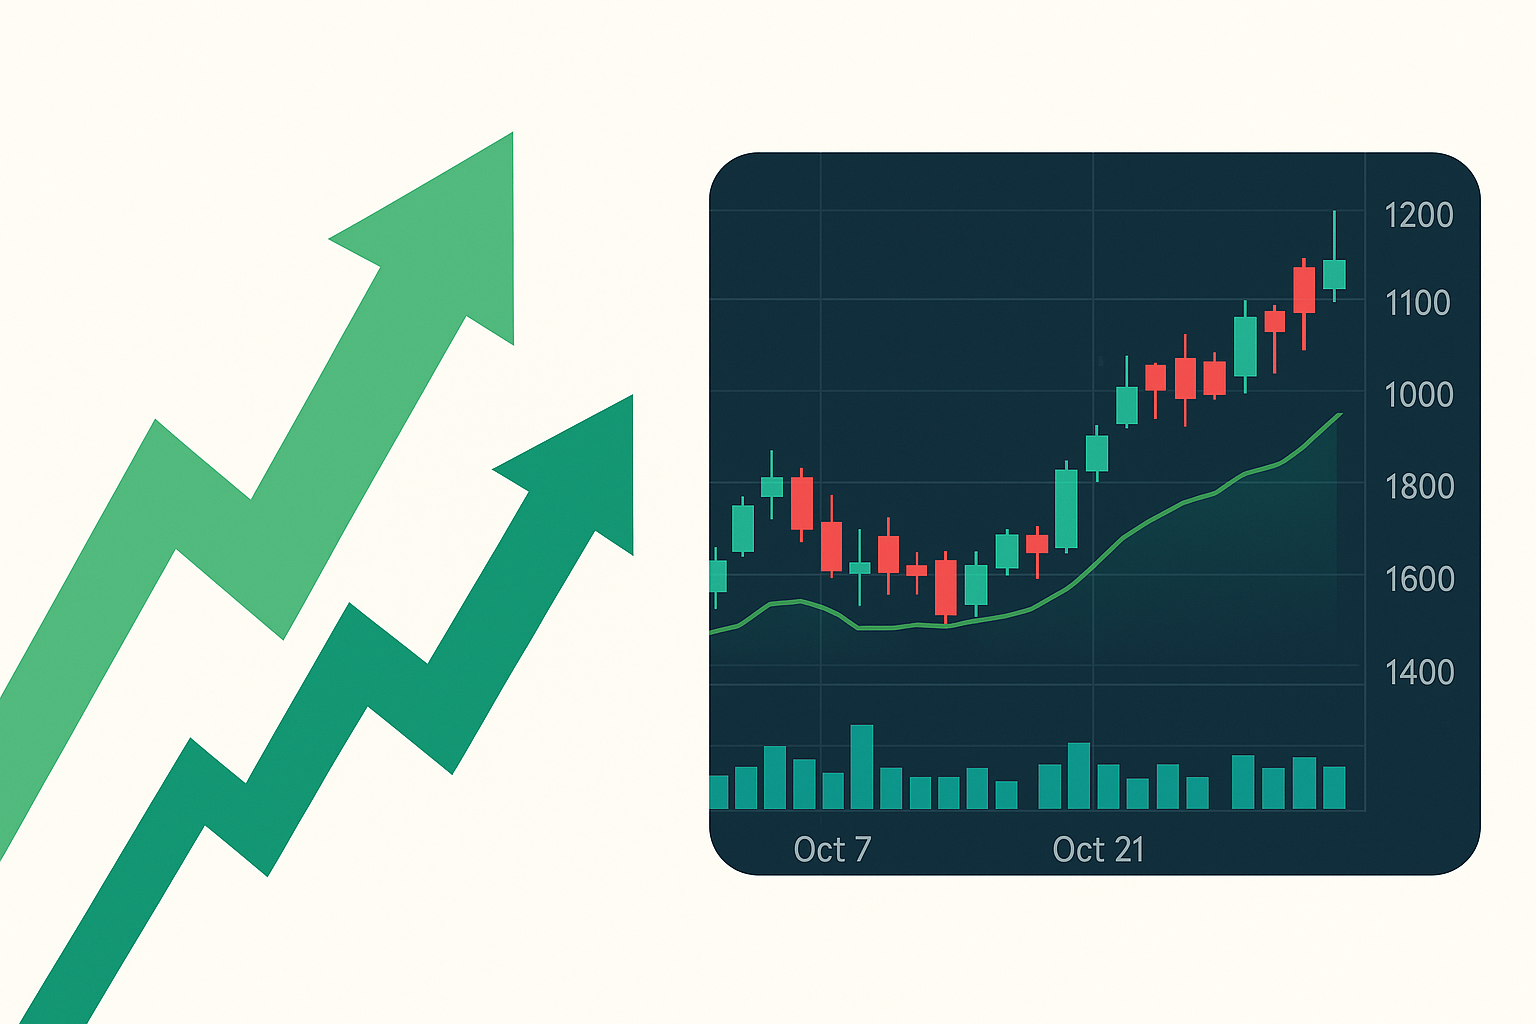
Adopted LightweightCharts
- A lightweight charting library published by TradingView
- Candlestick rendering is exceptionally fast
- Can be displayed easily in just a few dozen lines of code
- Works well with WASM
This is the first time the data is actually “visualized,”
and it’s the moment when you get that sense of validation: “Oh, this is actually working.”
Leave the Calculations to Rust/WASM (Subquery: The Meaning of Speed Optimization)
Why Go to the Trouble of Using WASM?
- Can process data faster than JavaScript
- Implement
calc_returnandcalc_hold_returnin Rust - Enables secure processing independent of the browser’s UI
- Improves UX by running without blocking
Answering the Search Intent
“What’s the benefit of WASM?” → Heavy computations become lighter
Recommendation
Even if you don’t plan to handle large-scale data, adopting WASM early on will make things easier down the road.
How to Deal with Doubts Like “Is This Really Worth It?”
Conclusion: Whether it’s worth it will become clear later
- “Building it yourself” deepens your understanding of stock price movements
- It provides a “sense of satisfaction” you can’t get from off-the-shelf tools
- If more features are added in the future, it’ll become a genuinely useful app
- The experience can definitely be applied to other development projects
Honestly, it’s okay to start with just a “vague” idea at first.
An idea that gets off the ground will grow along the way.
In fact, if you focus too much on finding meaning from the very beginning, you’ll never get started.
Features I Want to Add Next
I’m Starting to See Specific Areas for Expansion
- Enhance ticker search (in both Japanese and English)
- Backtesting with historical data
- Comparisons with the S&P 500 and TOPIX
- Experimenting with algorithms to visualize buy/sell points
- Optimizing the mobile UI
Just writing down these “desired features” like this boosts my motivation for development even further.
Summary
- A stock tool that started as a casual idea is turning out to be surprisingly robust
- Using Stooq’s CSV files makes it easy to retrieve data for free
- LightweightCharts for charts and Rust/WASM for calculations are a perfect match
- The purpose of building it will become clear later. The important thing is to just give it a try
Next Steps
→ Start by finding one “task you want to automate” and try coding it.
Projects that start with a spur-of-the-moment idea tend to last the longest.
Text for Discover (Short Version)
A stock tool I started developing on a whim has turned into a surprisingly useful “treasure trove of learning.” With free APIs for data retrieval, lightweight charting, and high-speed calculations using WASM—even beginners can build it surprisingly easily. Why not start by automating one thing that interests you?
Primary sources checked
Important claims should also link to the relevant source in the article body.